LGBTQ+ Identification Trends: What’s Changing
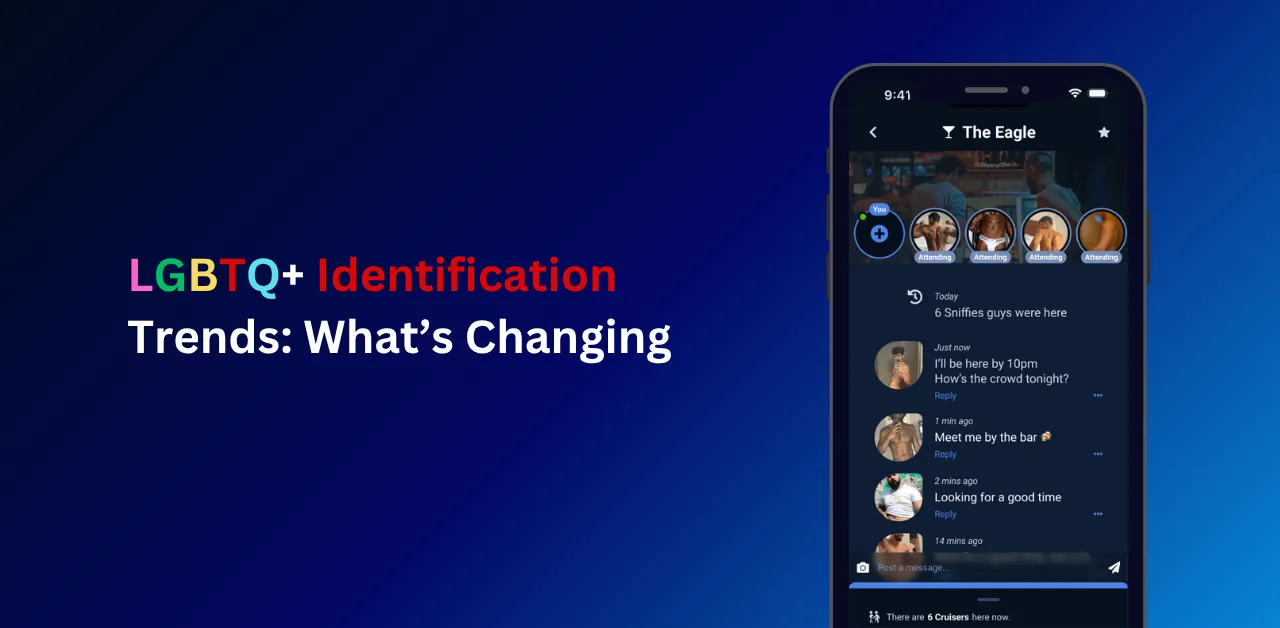
The landscape of LGBTQ+ identification is evolving rapidly, reflecting broader societal shifts in acceptance and self-expression. Over the past two decades, the percentage of people identifying as LGBTQ+ has surged, driven by younger generations and changing cultural norms. This article dives into the latest trends, backed by credible data, to provide a clear picture of how identification patterns are shifting, why they matter, and what they mean for individuals and communities. Whether you’re seeking to understand these trends for personal, professional, or advocacy purposes, this guide offers actionable insights and fresh perspectives.
Rising Rates of LGBTQ+ Identification
Recent studies show a significant increase in individuals identifying as LGBTQ+. According to Gallup, the percentage of U.S. adults identifying as LGBTQ+ doubled from 3.5% in 2012 to 7.1% in 2022, with nearly 20% of Gen Z adults (born 1997–2004) identifying as non-heterosexual. This growth is even more pronounced among younger cohorts, with 30% of Gen Z women identifying as non-heterosexual in some surveys.
Key drivers include:
- Increased Visibility: Greater representation in media and public life normalizes diverse identities.
- Cultural Acceptance: Legal protections and societal shifts encourage open self-identification.
- Access to Information: Online platforms provide resources for exploring identity, as seen in a 1300% surge in Google searches like “am I gay” or “am I trans” from 2004 to 2023.
This trend isn’t limited to the U.S. Globally, the LGBTQ+ community represents a growing demographic with an estimated $3.9 trillion in purchasing power, making it a critical audience for businesses and policymakers.
Generational Shifts in LGBTQ+ Identity
The rise in LGBTQ+ identification is most evident among younger generations. Here’s a breakdown by generation based on recent data:
| Generation | % Identifying as LGBTQ+ | Key Characteristics |
|---|---|---|
| Gen Z (1997–2004) | ~20% | High rates of bisexual and nonbinary identification; open to fluid identities. |
| Millennials (1981–1996) | ~12% | More likely to identify as gay or lesbian; advocate for inclusivity. |
| Gen X (1965–1980) | ~5% | Lower identification rates; often tied to traditional norms. |
| Boomers (1946–1964) | ~2% | Least likely to identify as LGBTQ+; influenced by historical stigma. |
Gen Z’s openness stems from growing up in a digital era with access to communities on platforms like Instagram and TikTok, where “Gay TikTok” and other subcultures thrive. Millennials, meanwhile, have driven advocacy through workplace inclusion and media representation, as evidenced by the Human Rights Campaign’s Corporate Equality Index, where 765 employers scored a perfect 100 in 2025 for LGBTQ+ inclusive policies.
Actionable Tip: If you’re engaging with younger audiences, consider creating content that resonates with fluid identities, such as blogs on navigating queer relationships or exploring gender identity. These align with the informational intent of users seeking relatable experiences.
Regional Variations in Identification
LGBTQ+ identification varies significantly by region, reflecting cultural, religious, and political differences. Google Trends data from 2004 to 2023 highlights surprising hotspots:
- Utah: Tops searches for “am I gay,” “am I trans,” and “nonbinary,” suggesting internal conflict between personal identity and conservative societal norms.
- Taiwan: High search interest in “LGBT-friendly vacation destinations,” indicating a demand for safe spaces.
- Australia: Peaks in searches for “LGBT counseling near me” and “how to come out,” reflecting a focus on support and self-discovery.
These regional insights reveal a need for localized resources. For example, businesses in conservative areas can support the community by adding “LGBTQ+-friendly” attributes to their Google Business Profiles, a step Google introduced in 2022 to enhance inclusivity.
Practical Insight: If you operate a business, update your Google Business Profile with attributes like “LGBTQ+-friendly” or “transgender safe space.” Follow Google’s guide to apply these tags, ensuring visibility for searches like “LGBTQ-friendly businesses near me.”
Common Questions and Pain Points
Google’s “People Also Ask” and “Related Searches” reveal what users want to know about LGBTQ+ identification trends:
- What percentage of people are LGBTQ+? As noted, 7.1% of U.S. adults identify as LGBTQ+, with higher rates among Gen Z (20%) and women (30% of Gen Z women).
- Why are more people identifying as LGBTQ+? Factors include greater societal acceptance, media visibility, and access to online communities.
- How do I support the LGBTQ+ community? Businesses can adopt inclusive policies, while individuals can educate themselves through resources like Sniffies’ guide to allyship.
- What are the challenges for LGBTQ+ individuals? Many face isolation, lack of safe spaces, and online censorship, as seen in reports of platforms like Instagram restricting LGBTQ+ content.
Addressing these questions ensures content meets informational intent, providing clear answers and actionable steps.
Challenges and Opportunities for Engagement
The LGBTQ+ community faces unique challenges, including online censorship and lack of representation. A 2020 study found that platforms like YouTube and Google News often amplify anti-LGBTQ+ content while demonetizing or restricting neutral LGBTQ+ content, impacting creators and news outlets. Meanwhile, brands that show consistent support—beyond Pride Month—build trust. For example, ANZ Bank’s 2018 “#HoldTight” campaign highlighted the fear many LGBTQ+ couples feel holding hands in public, resonating deeply with audiences.
How Brands and Individuals Can Respond
For Businesses
To engage the LGBTQ+ community effectively:
- Update Digital Profiles: Add “LGBTQ+-friendly” attributes to Google Business Profiles and respond to reviews highlighting inclusivity.
- Create Inclusive Content: Develop blogs or videos addressing community needs, like mental health resources or safe travel guides.
- Avoid Tokenism: Ensure marketing reflects genuine commitment, as seen in Oreo’s consistent rainbow-themed campaigns despite backlash.
For Individuals
To support the community:
- Educate Yourself: Use resources like GLAAD’s Media Reference Guide to understand terminology and avoid stereotypes.
- Advocate Locally: Search for “LGBTQ-friendly businesses near me” to support inclusive spaces.
- Engage Online: Follow and share content from LGBTQ+ creators to amplify their voices.
What percent of the US is LGBTQ+?
In 2025, 9.3% of adults identify as LGBTQ+, per Gallup.
Why is LGBTQ+ identification rising?
Acceptance, media visibility, and youth openness drive the increase.
Who identifies most as LGBTQ+?
Gen Z women, with 31% identifying, lead the trend.
Why These Trends Matter
Rising LGBTQ+ identification reflects growing acceptance. But challenges like discrimination persist. supporting queer youth means creating safe spaces and amplifying voices. Share your thoughts on X with #LGBTQTrends and explore supporting queer youth. Let’s keep the momentum going! 🌟
For more support and ideas, see our post on Supporting LGBTQ+ Youth and Dating and Relationships in The Gay Community


